Listening to the song of melting glaciers
Sounds can help scientists piece together what's happening hundreds of meters below a glacier's surface.
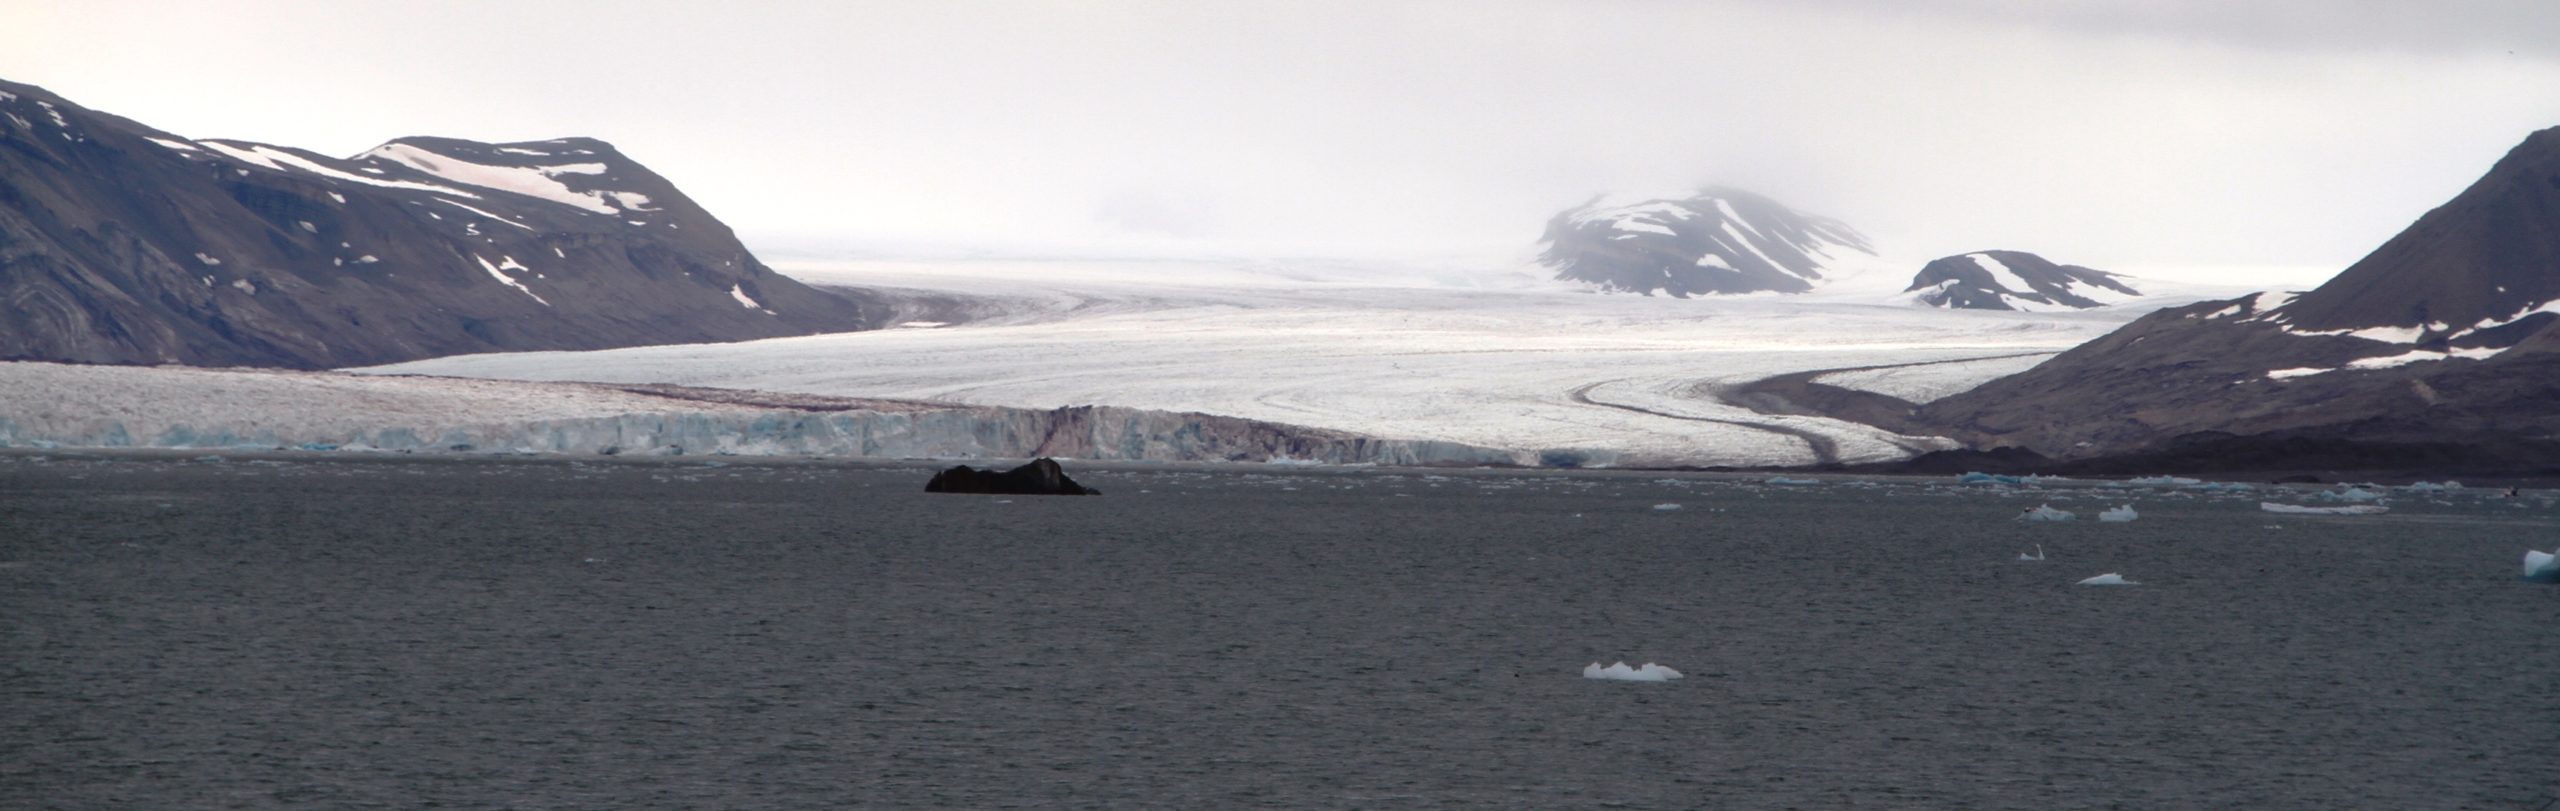
August 22, 2022. Kongsvegen glacier, 20 kilometers west of Ny Ålesund, Svalbard archipelago, Norway.
This is it, we have reached the bottom of the glacier. It is 327 meters under our feet. After drilling into the ice for six hours, our hot water jet blasts into the sediment. The hose that connects it to the surface stops rolling and Thomas Schuler, the project leader, confirms that the base has been reached.
I get off the helicopter and Coline Bouchayer, a PhD researcher overseeing the project, tells me the good news. We let out a sigh of relief — John Hult, the project engineer, and Svein Oland, a mechanic from the Norwegian Polar Institute, are particularly content. We had tried to carry out the same operation last spring, but the minus 30 degrees Celsius temperatures froze the water in the drilling system, making it impossible to continue. This time, the engines that are still running bring a smell of diesel to the frozen lands around us.
(T.V. Schuler)
Our goal here is not to reconstruct past climates by extracting ice cores like missions in Antarctica or Greenland. Instead, it is to explore what happens hundreds of meters below the surface, where the glacier rests on its bed of rocks and sediment. This is where their stability is at stake, as liquid water from the surface seeps in and acts as a lubricant.
Rapidly rising temperatures brought on by climate change are set to melt glaciers and trigger instabilities, as predicted by the Intergovernmmental Panel on Climate Change (IPCC). Current policies are projected to result in about 2.7 degrees C warming above pre-industrial levels by 2100, way above the 1.5 degrees C maximum recommended limit by the Paris agreement. Such differences can be drastic for glaciers. These ice dragons, which look as if they were asleep, can wake up a little too suddenly, as shown by the recent collapse of glaciers in the Italian Alps.
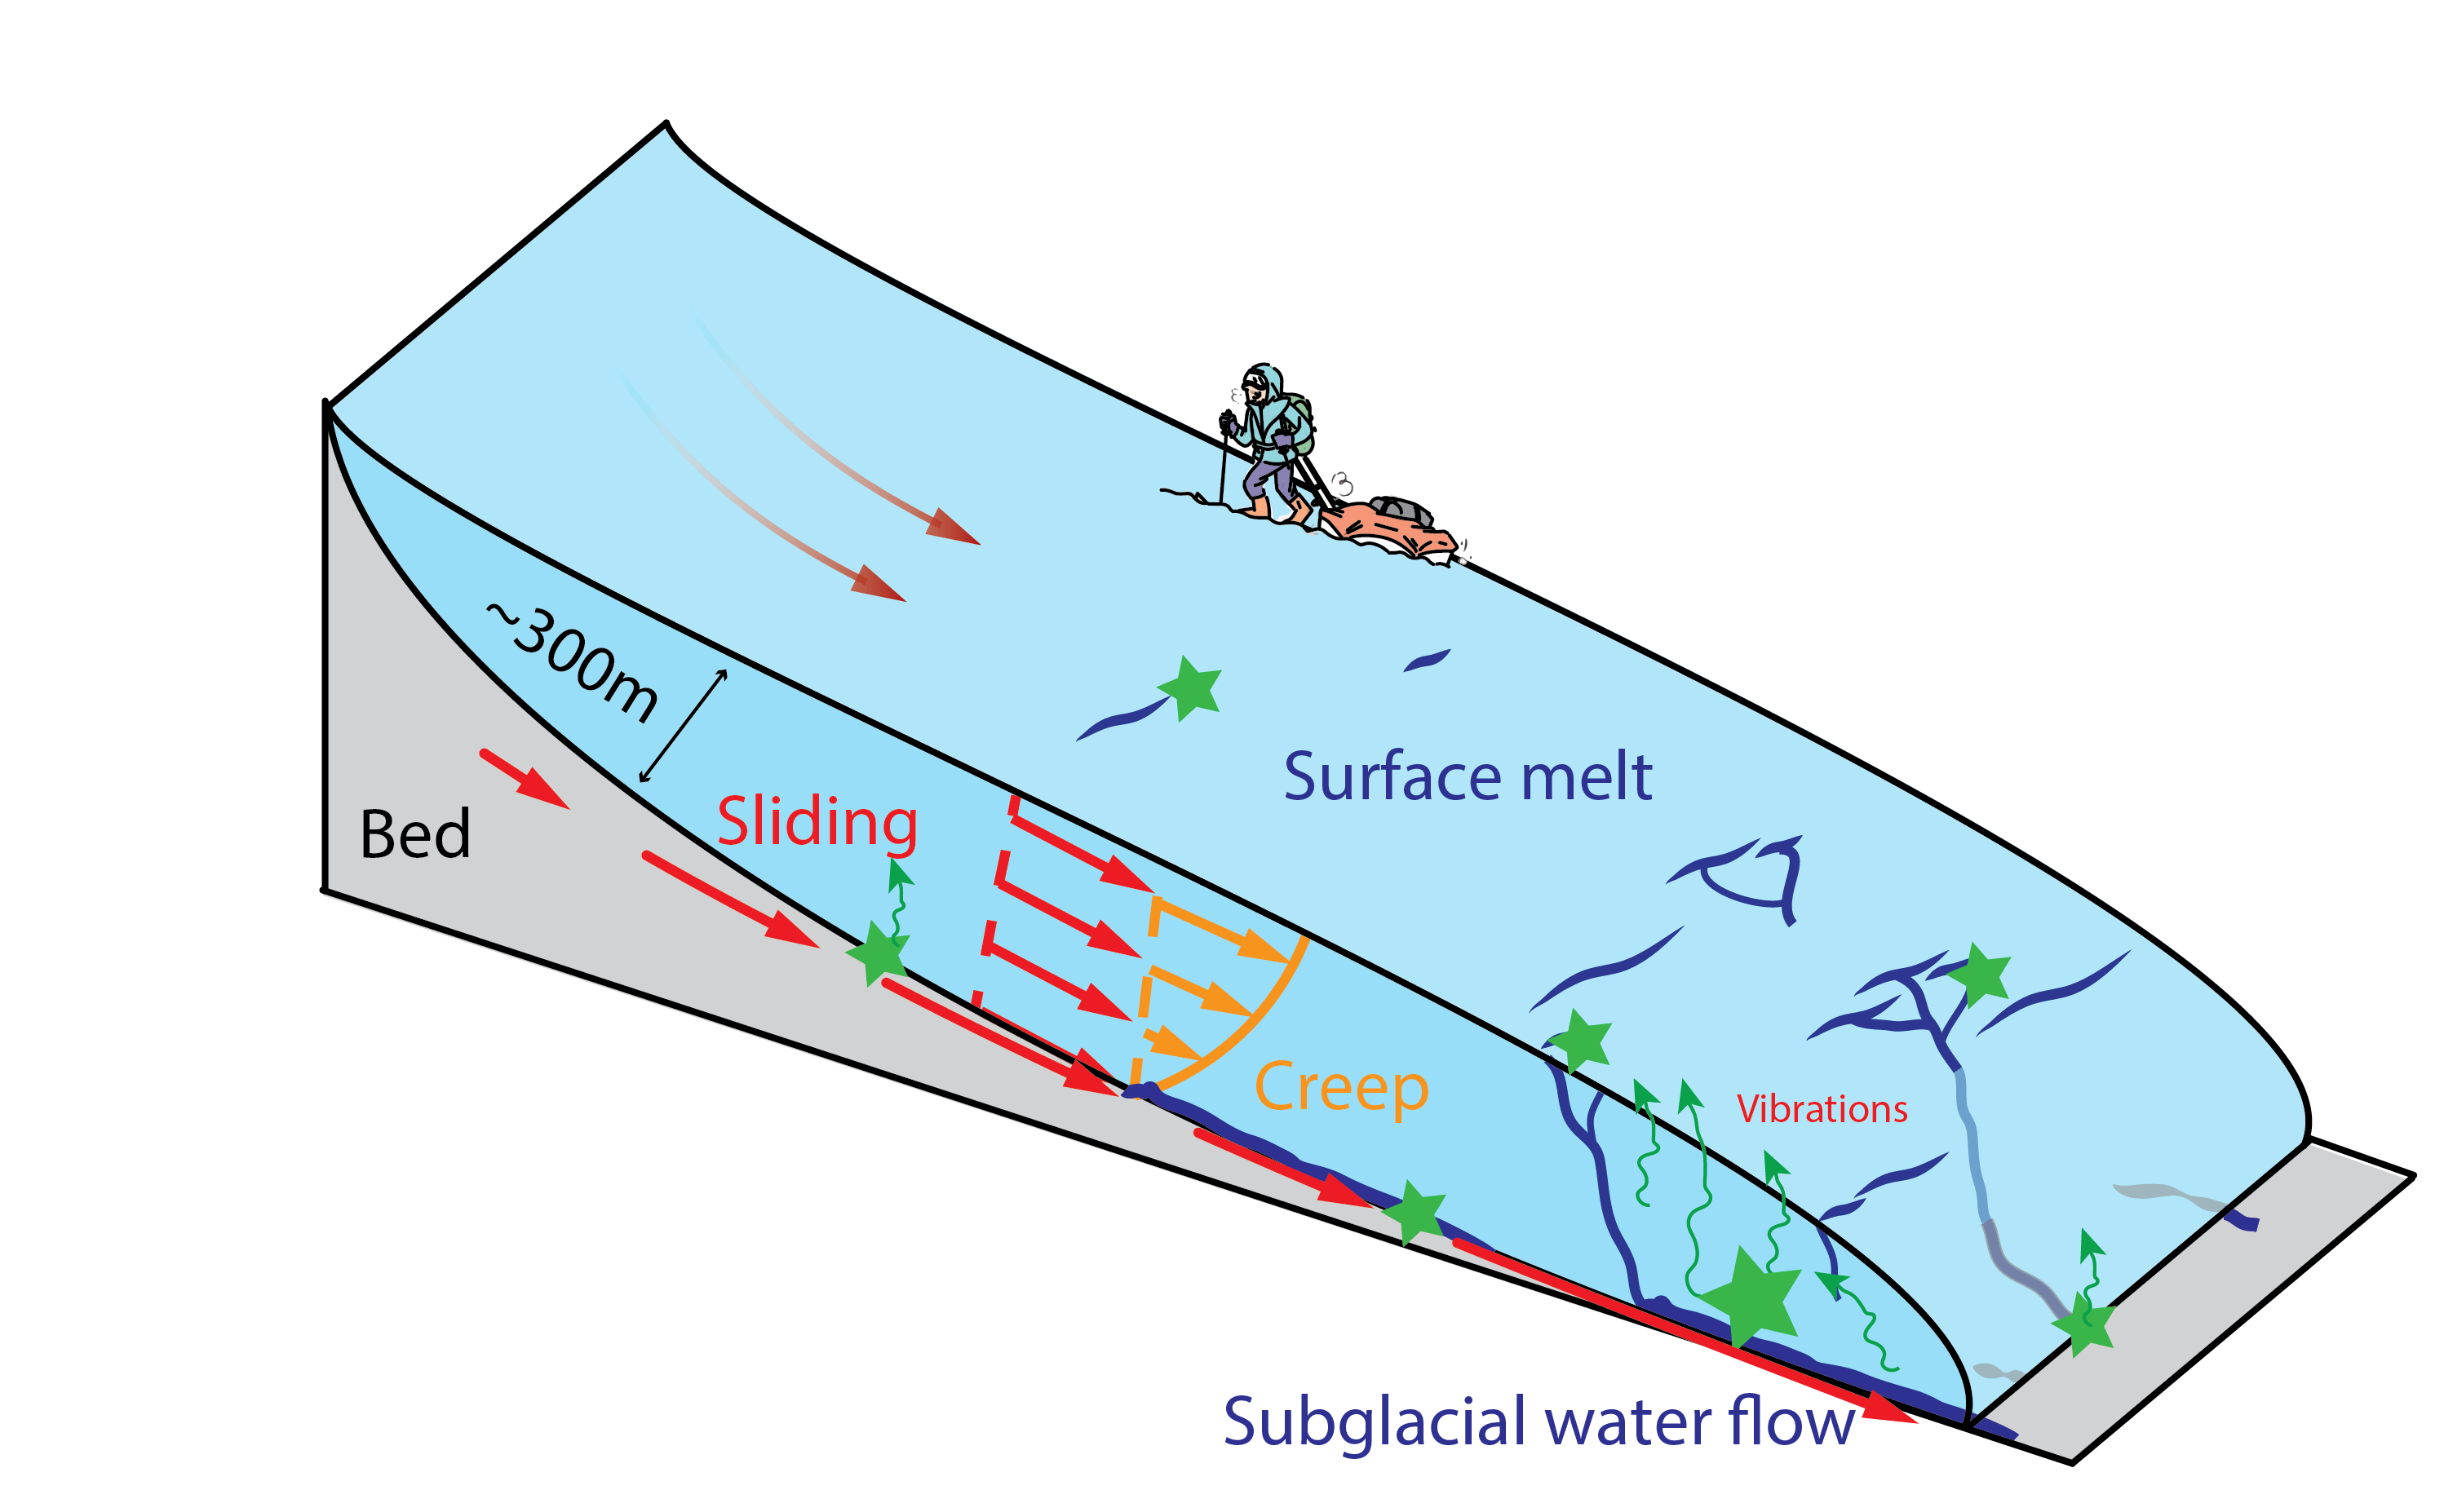
The movement of glaciers (from a few meters to several kilometers per year) is similar to that of a soft cheese on a sloping board: they sway over their entire height and creep under their own weight. The steeper and thicker they are (up to several kilometers), the faster they flow to lower altitudes. Thanks to the thin layer of water between the ice and its rocky bed, glaciers can double their speed between winter and summer. While most glaciers enjoy a stable seasonal cycle, some, including Kongsvegen, have seen their annual speed increase over the years.
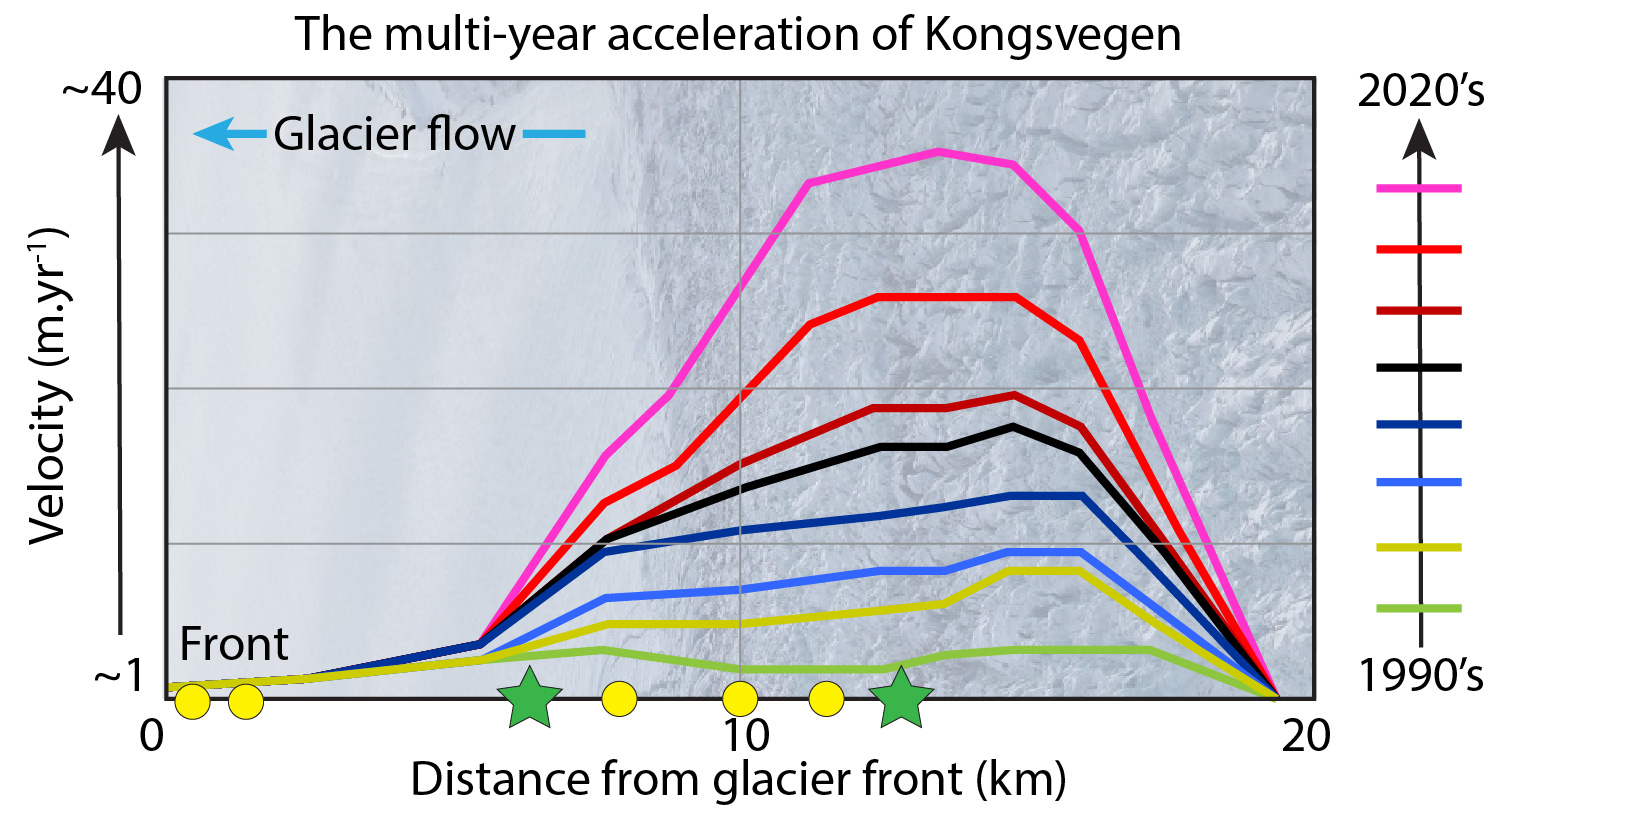
This is known as a glacial surge. Since 2010, the speed of the upper part of Kongsvegen has increased from a few meters a year to more than 40 — a tenfold increase. For the time being, this only affects the upper part of the glacier, but we are seeing a progression from year to year toward the lower areas.
We believe that this dynamic could lead to a destabilization of the glacier, and if this happens, this glacier, which is more than 15 kilometers long, 2 kilometers wide, and 300 meters thick, could plunge into the ocean and cause major damage to the entire fjord. And Kongsvegen is just one of thousands of cases across the world. To understand this, we melt our way downward and plunge our instruments into the unknown heart of the glacier.
Our scientific mission aims to listen to Kongsvegen and measure the forces that it exerts on its underlying rocky bed. If these forces are greater than what the bed can hold, then we start to have serious problems.
The slightest movement of a glacier generates a vibration that contains crucial information about its dynamics. The sound of glaciers is primitive. It travels from your ears to your guts. You hear your desire of exploration as well as the impact of our society on our environment. It is difficult to say whether they are mourning, singing or laughing, but they are certainly not silent. This year, my friend Clovis Tisserand, a sound designer, came with me to record these voices from the Arctic.
Ugo Nanni, CC BY 55.8 MB (download)
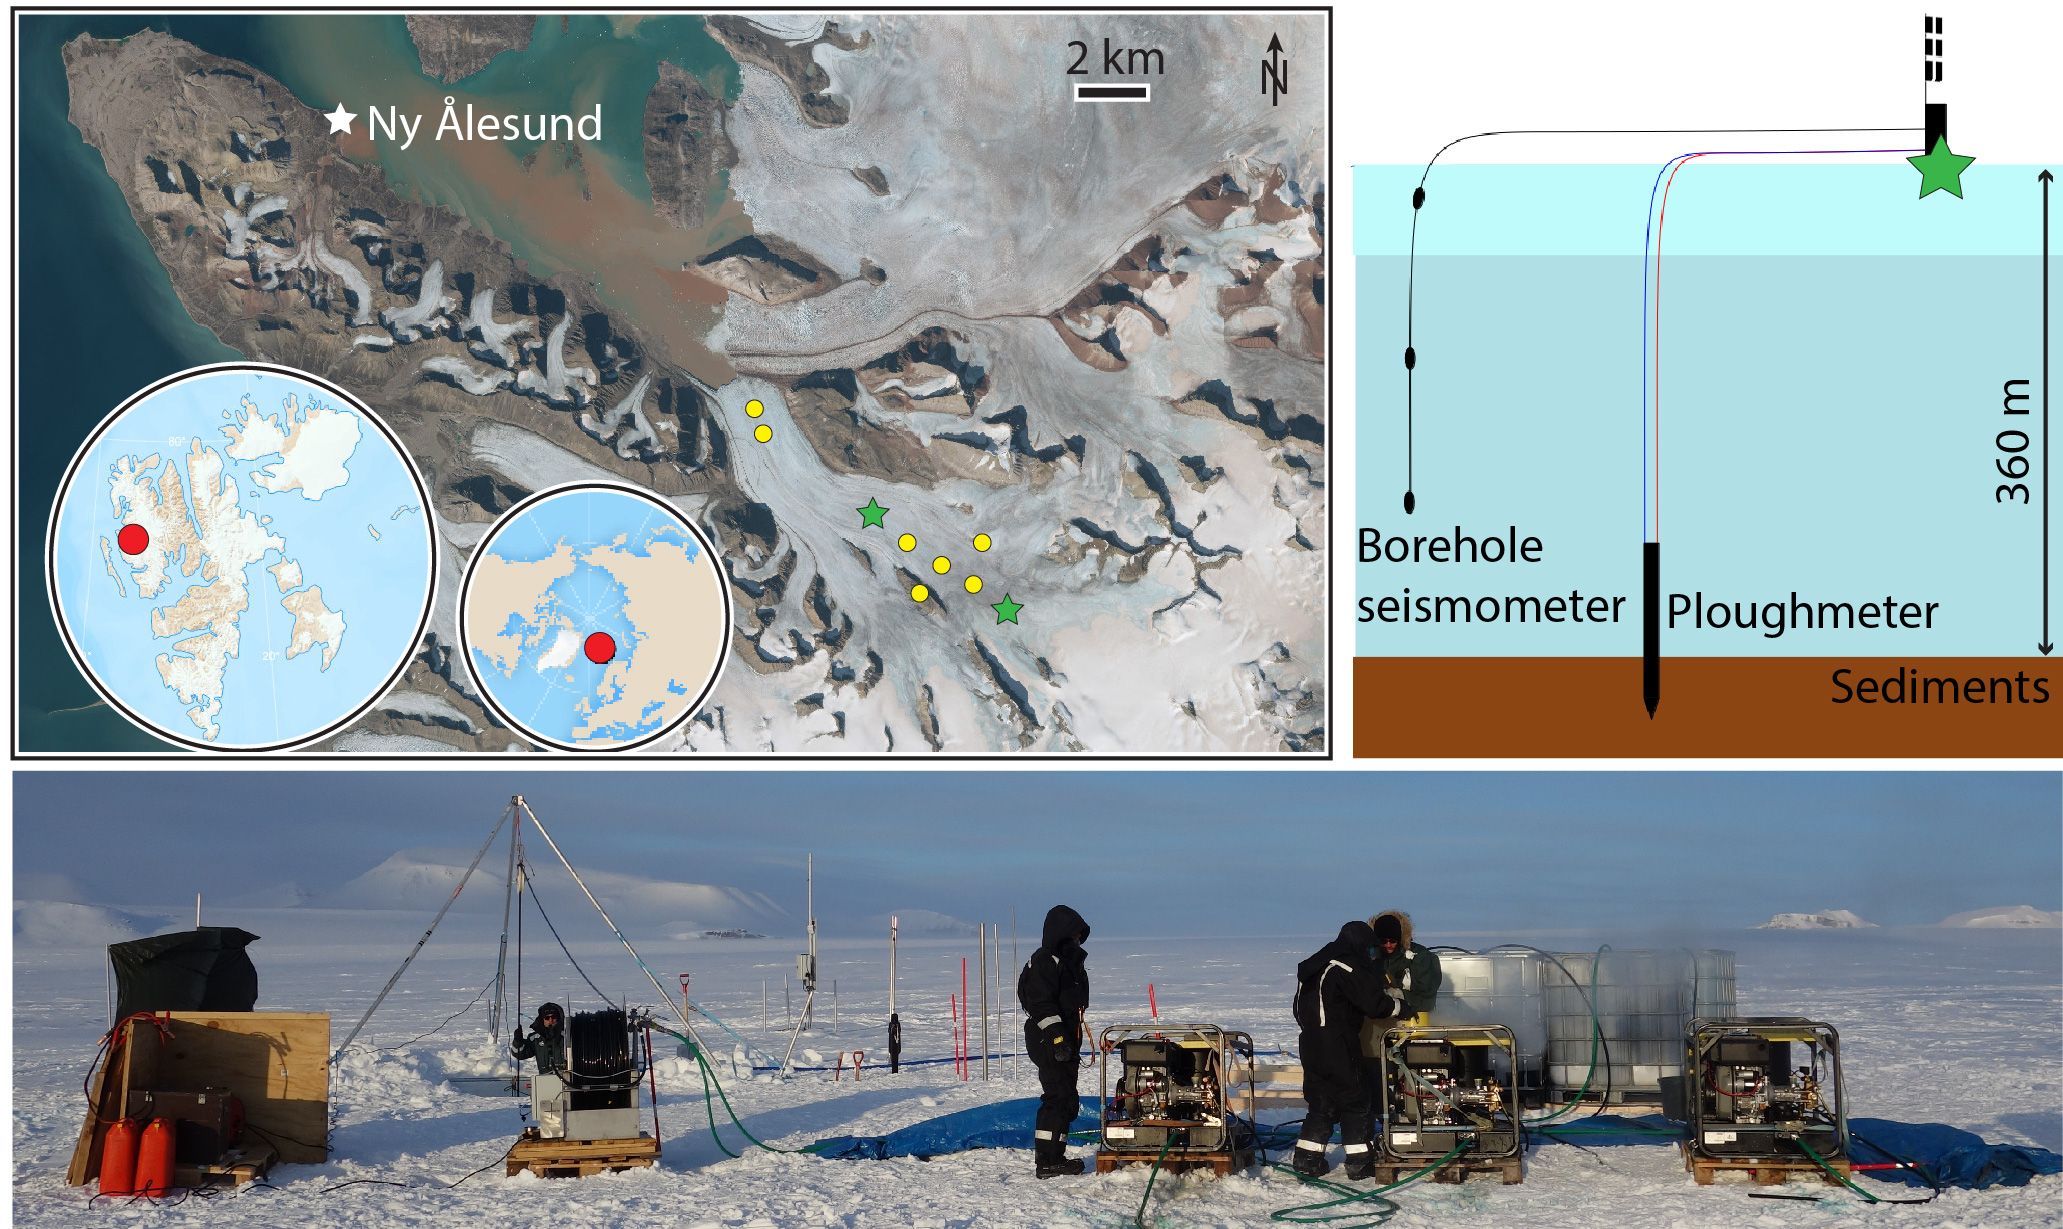
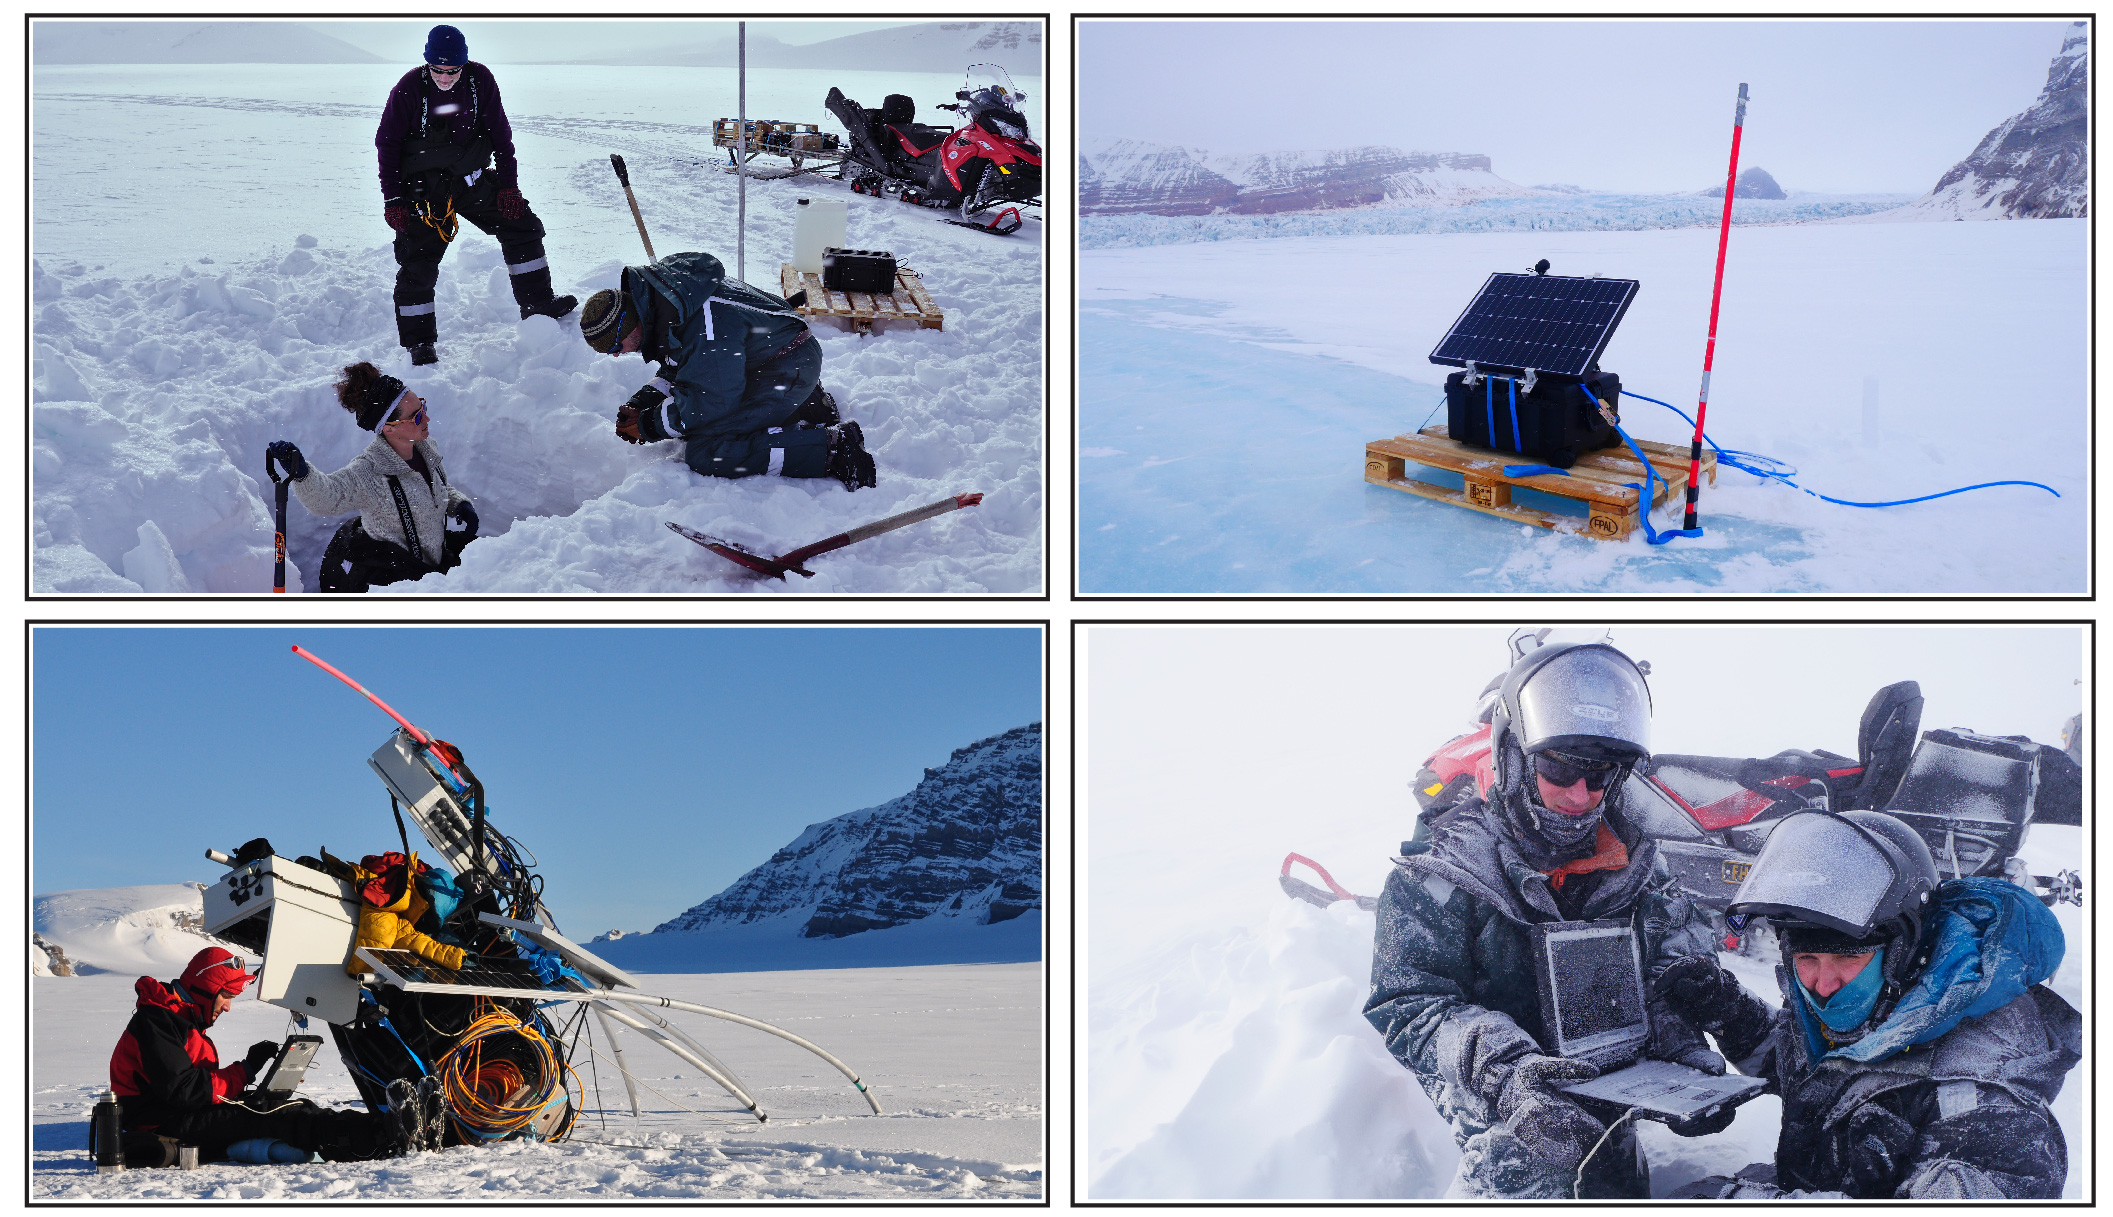
My job is to analyze these sounds to understand how the glacier moves, how it reacts to surface melting, how its crevasses open and what is happening in its depths. To do this, we use seismometers, traditionally employed to study earthquakes. Since 2020, we have installed about 20 of these along the length of Kongsvegen and in its depths. With such a network, we can listen to the whole glacier, like a doctor with a stethoscope, and its secrets (as we recently did in the French Alps). On top of these seismometers, we have also installed a rather unusual instrument, a long 2-meter steel rod planted at a depth of 360 meters called a ploughmeter (Figure 1).
On this rod, John installed several strain gauges to measure the forces at the base of the glacier. The ploughmeter we installed this summer only transmitted its measurements for a few hours before going silent despite days spent by John trying to revive it. Fortunately for Coline, whose Ph.D. is partly based on these measurements, the one installed in spring 2021 is still talking. Since that date, we have therefore been able to measure how the glacier vibrates, distorts itself and slides in response to changes in temperature and precipitation.
Collecting this data was time-consuming, costly, and subject to many uncertainties. It was made possible thanks to the support of numerous colleagues, the Norwegian Polar Institute and the Sverdrup Station in Ny Ålesund.
Back from the field
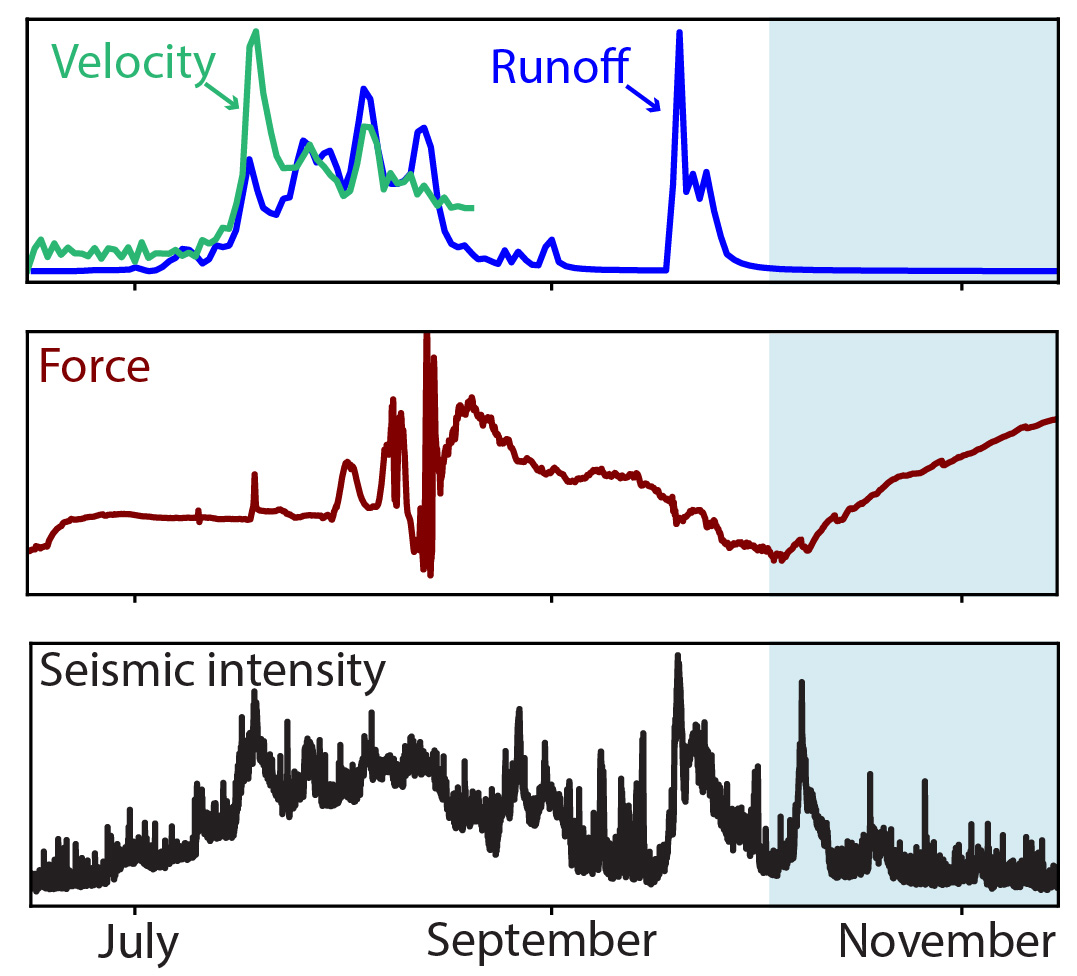
Back from the field, long months pass, in front of our computer or around a table, converting, filtering, and comparing the curves drawn by our observations. We find that the dynamics of Kongsvegen are governed by a melting season from June to October, during which several thousands of liters of water flow every second over the surface and base of the glacier. The duration and intensity of such melting has been observed to increase with the rising temperature due to climate change.
All this water lubricates the base of the glacier and causes an increase in the velocity and stresses inside the glacier. At the same time, we measure an increase in the intensity of glacial vibrations, related to hydrological noise and intense crevasse activity under the influence of summer heat and glacier acceleration. This summer we observed an increased presence of crevasses and measured an increase in stress compared to last year. This could be a sign of a strong acceleration or even destabilization of the glacier.
Our team, together with several colleagues, is currently analyzing these results to quantify the causes of these changes, and thus better understand what leads to the destabilization of a glacier in a melting world.
Further reading:
● “Did you know… that glaciers can sing?”, a blog post about seismic measurements on glaciers.
● “Estimation of Marmolada glacier collapse volume using Pléiades imagery”, a blog post explaining the Marmolada collapse.![]()
Ugo Nanni is a research scientist a University of Oslo.
This article is republished from The Conversation under a Creative Commons license. Read the original article.