How cables in glaciers could help forecast future sea level rise
The movement of Greenland’s glaciers is far more complicated than previously thought.
Fiber-optic cables usually make us think of ultra-fast internet — or maybe the irritation of new installation works digging up the pavement. But there are now such cables snaking their way through the center of the planet’s second largest body of ice, the Greenland ice sheet.
Fiber-optic technologies are allowing us to monitor the internal structure of glaciers in unprecedented levels of detail. In our new study, we show how fiber-optics are offering extraordinary new insight into how ice sheets evolve — and how the movement of Greenland’s glaciers is far more complicated than previously thought.
Ice loss from Greenland has increased sixfold since the 1980s, and the melting ice sheet is now the single biggest contributor to global sea level rise. In order to forecast the ice sheet’s future — including its worrying rates of melting — we need to understand the thermodynamic processes at work within it. That means we need to take its temperature as accurately as we can.
Surface conditions can be detected simply enough using satellites or in-person observations, but plumbing the deepest reaches of the ice sheet, a moving block of ice a kilometer thick, is a whole different challenge.
This is where fiber-optics come in. In any home broadband network, information travels through fiber-optic cables as a series of light pulses. We use a similar idea in our work, firing bursts of light from a laser into a length of cable.
However, the cable isn’t perfectly smooth: so as the light travels, some will be reflected from tiny flaws in the cable wall, much like how light bounces off the reflective shards on a disco ball. As the cable changes temperature, or is stretched slightly by tiny earthquakes, the flaws changes: and so do the characteristics of the reflections. By continually monitoring these changes, we build up a detailed picture of what the glacier is like deep under its icy surface.
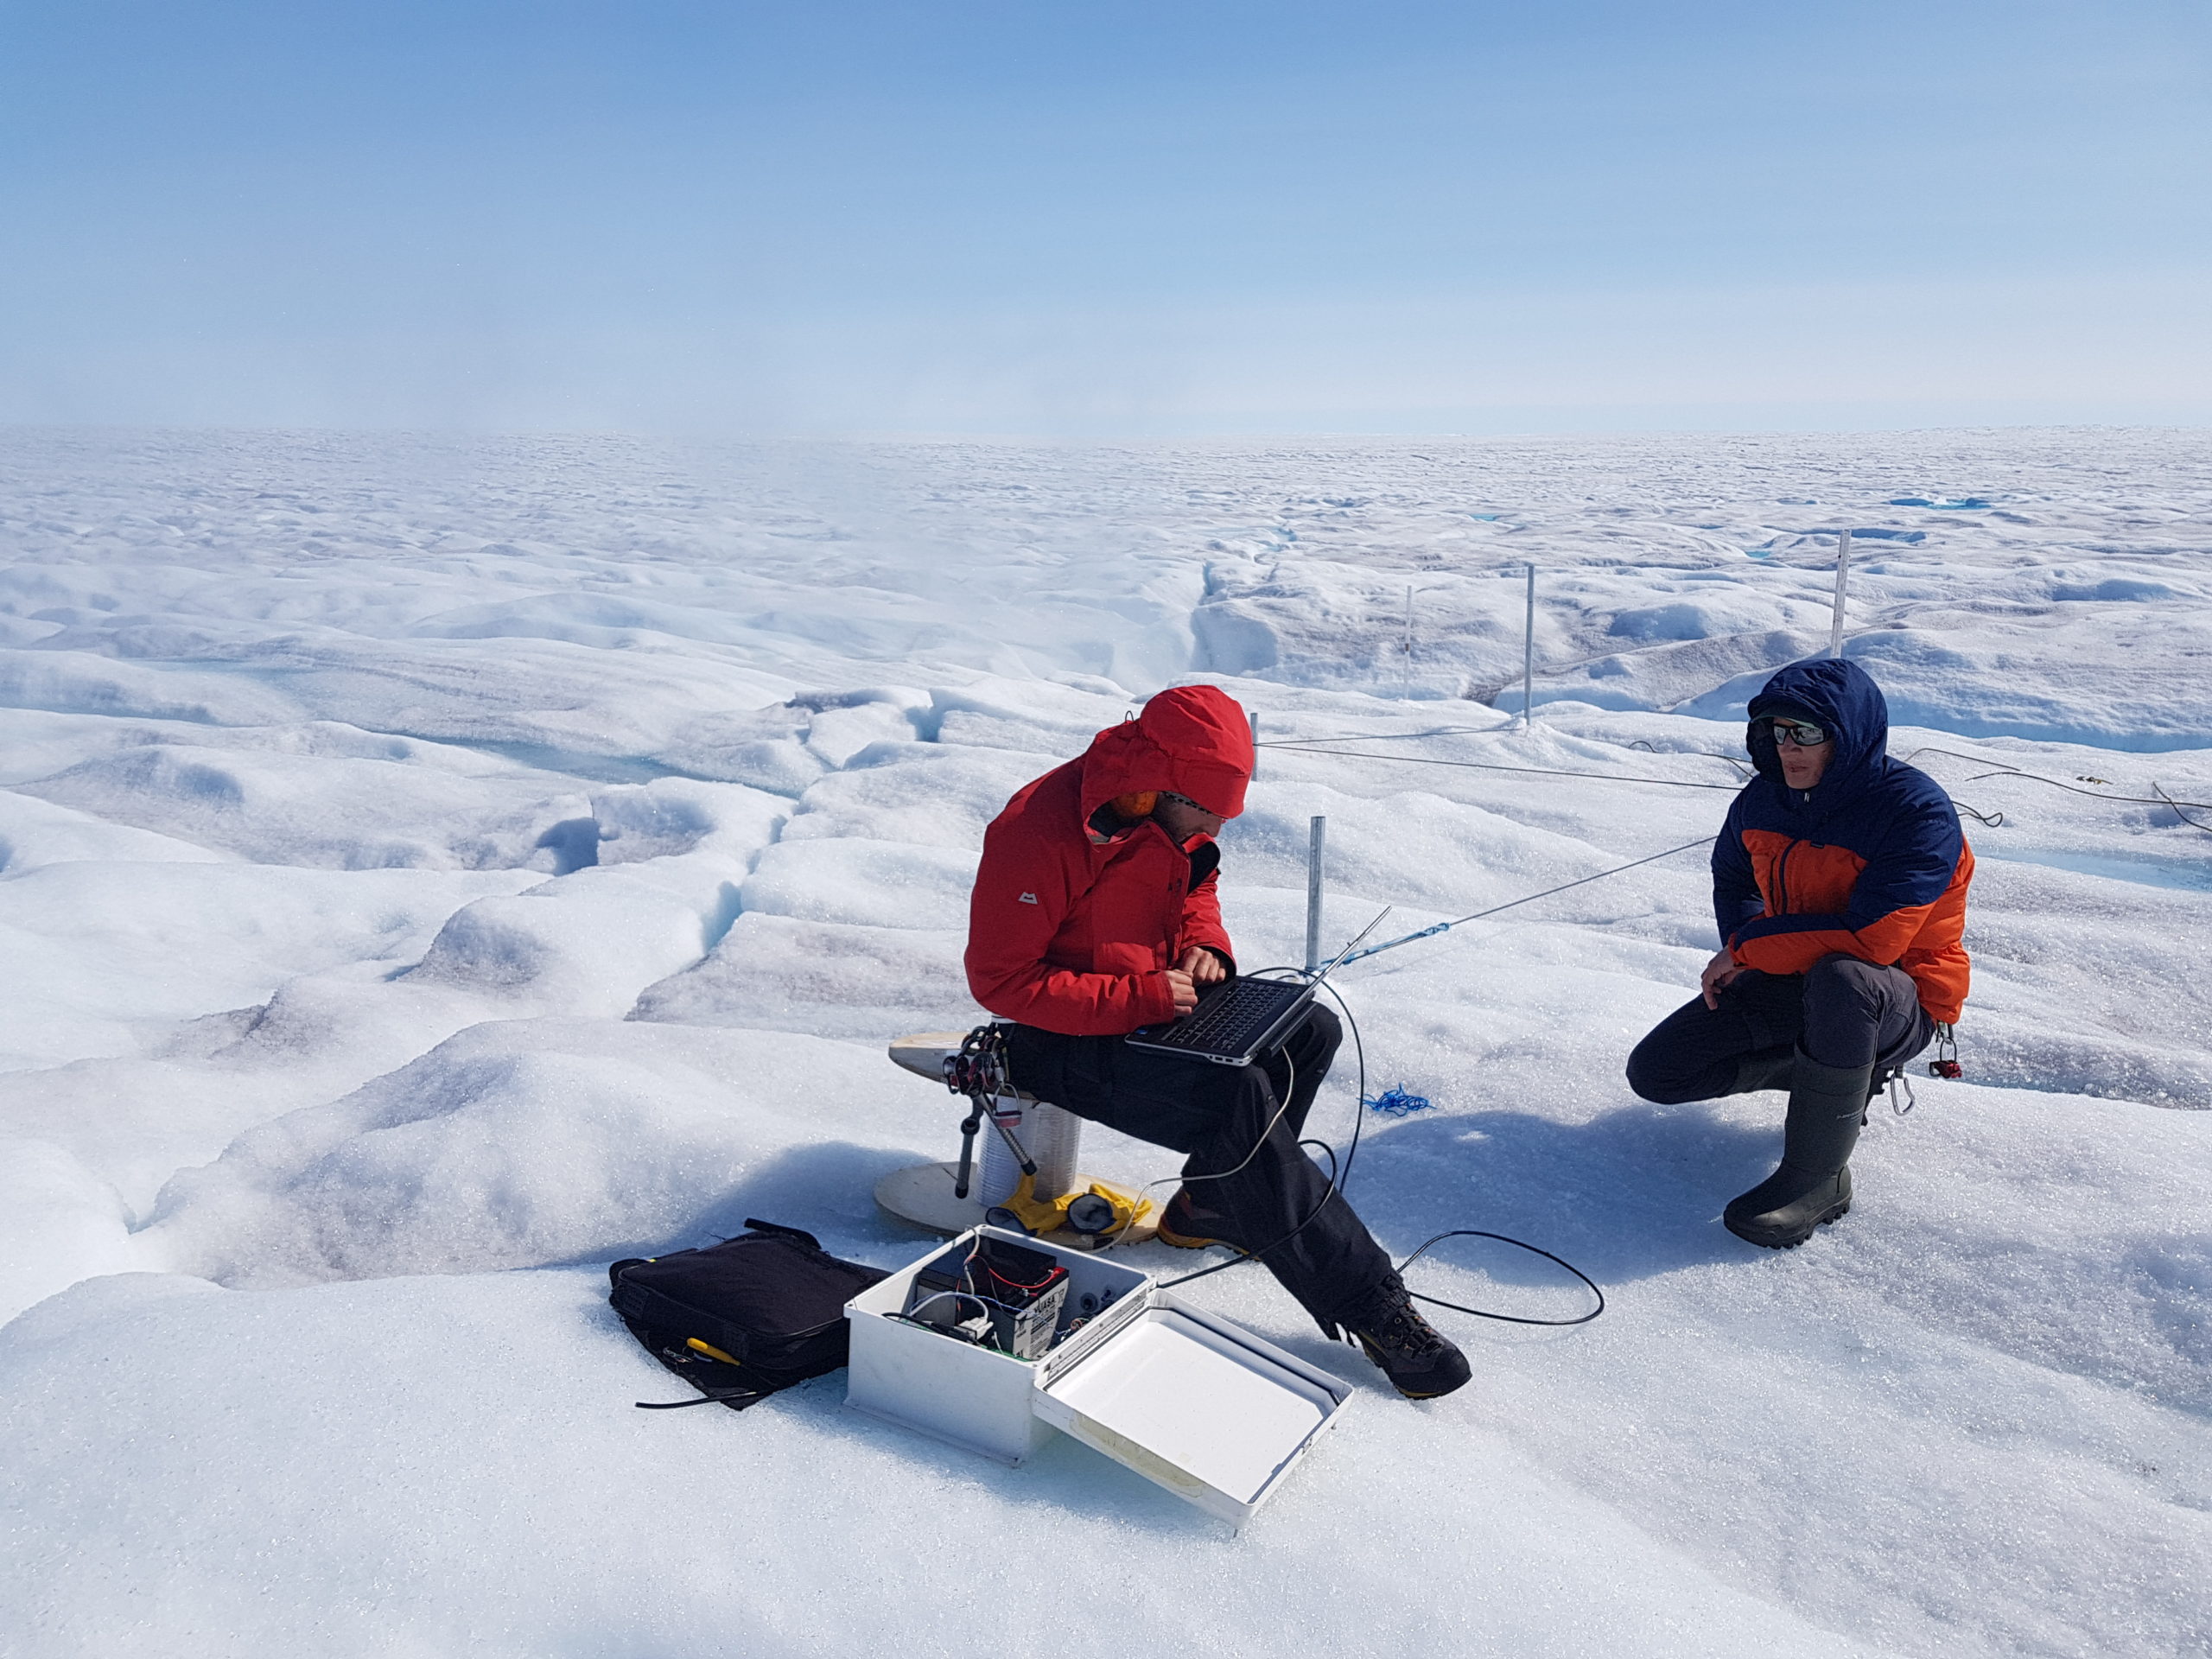
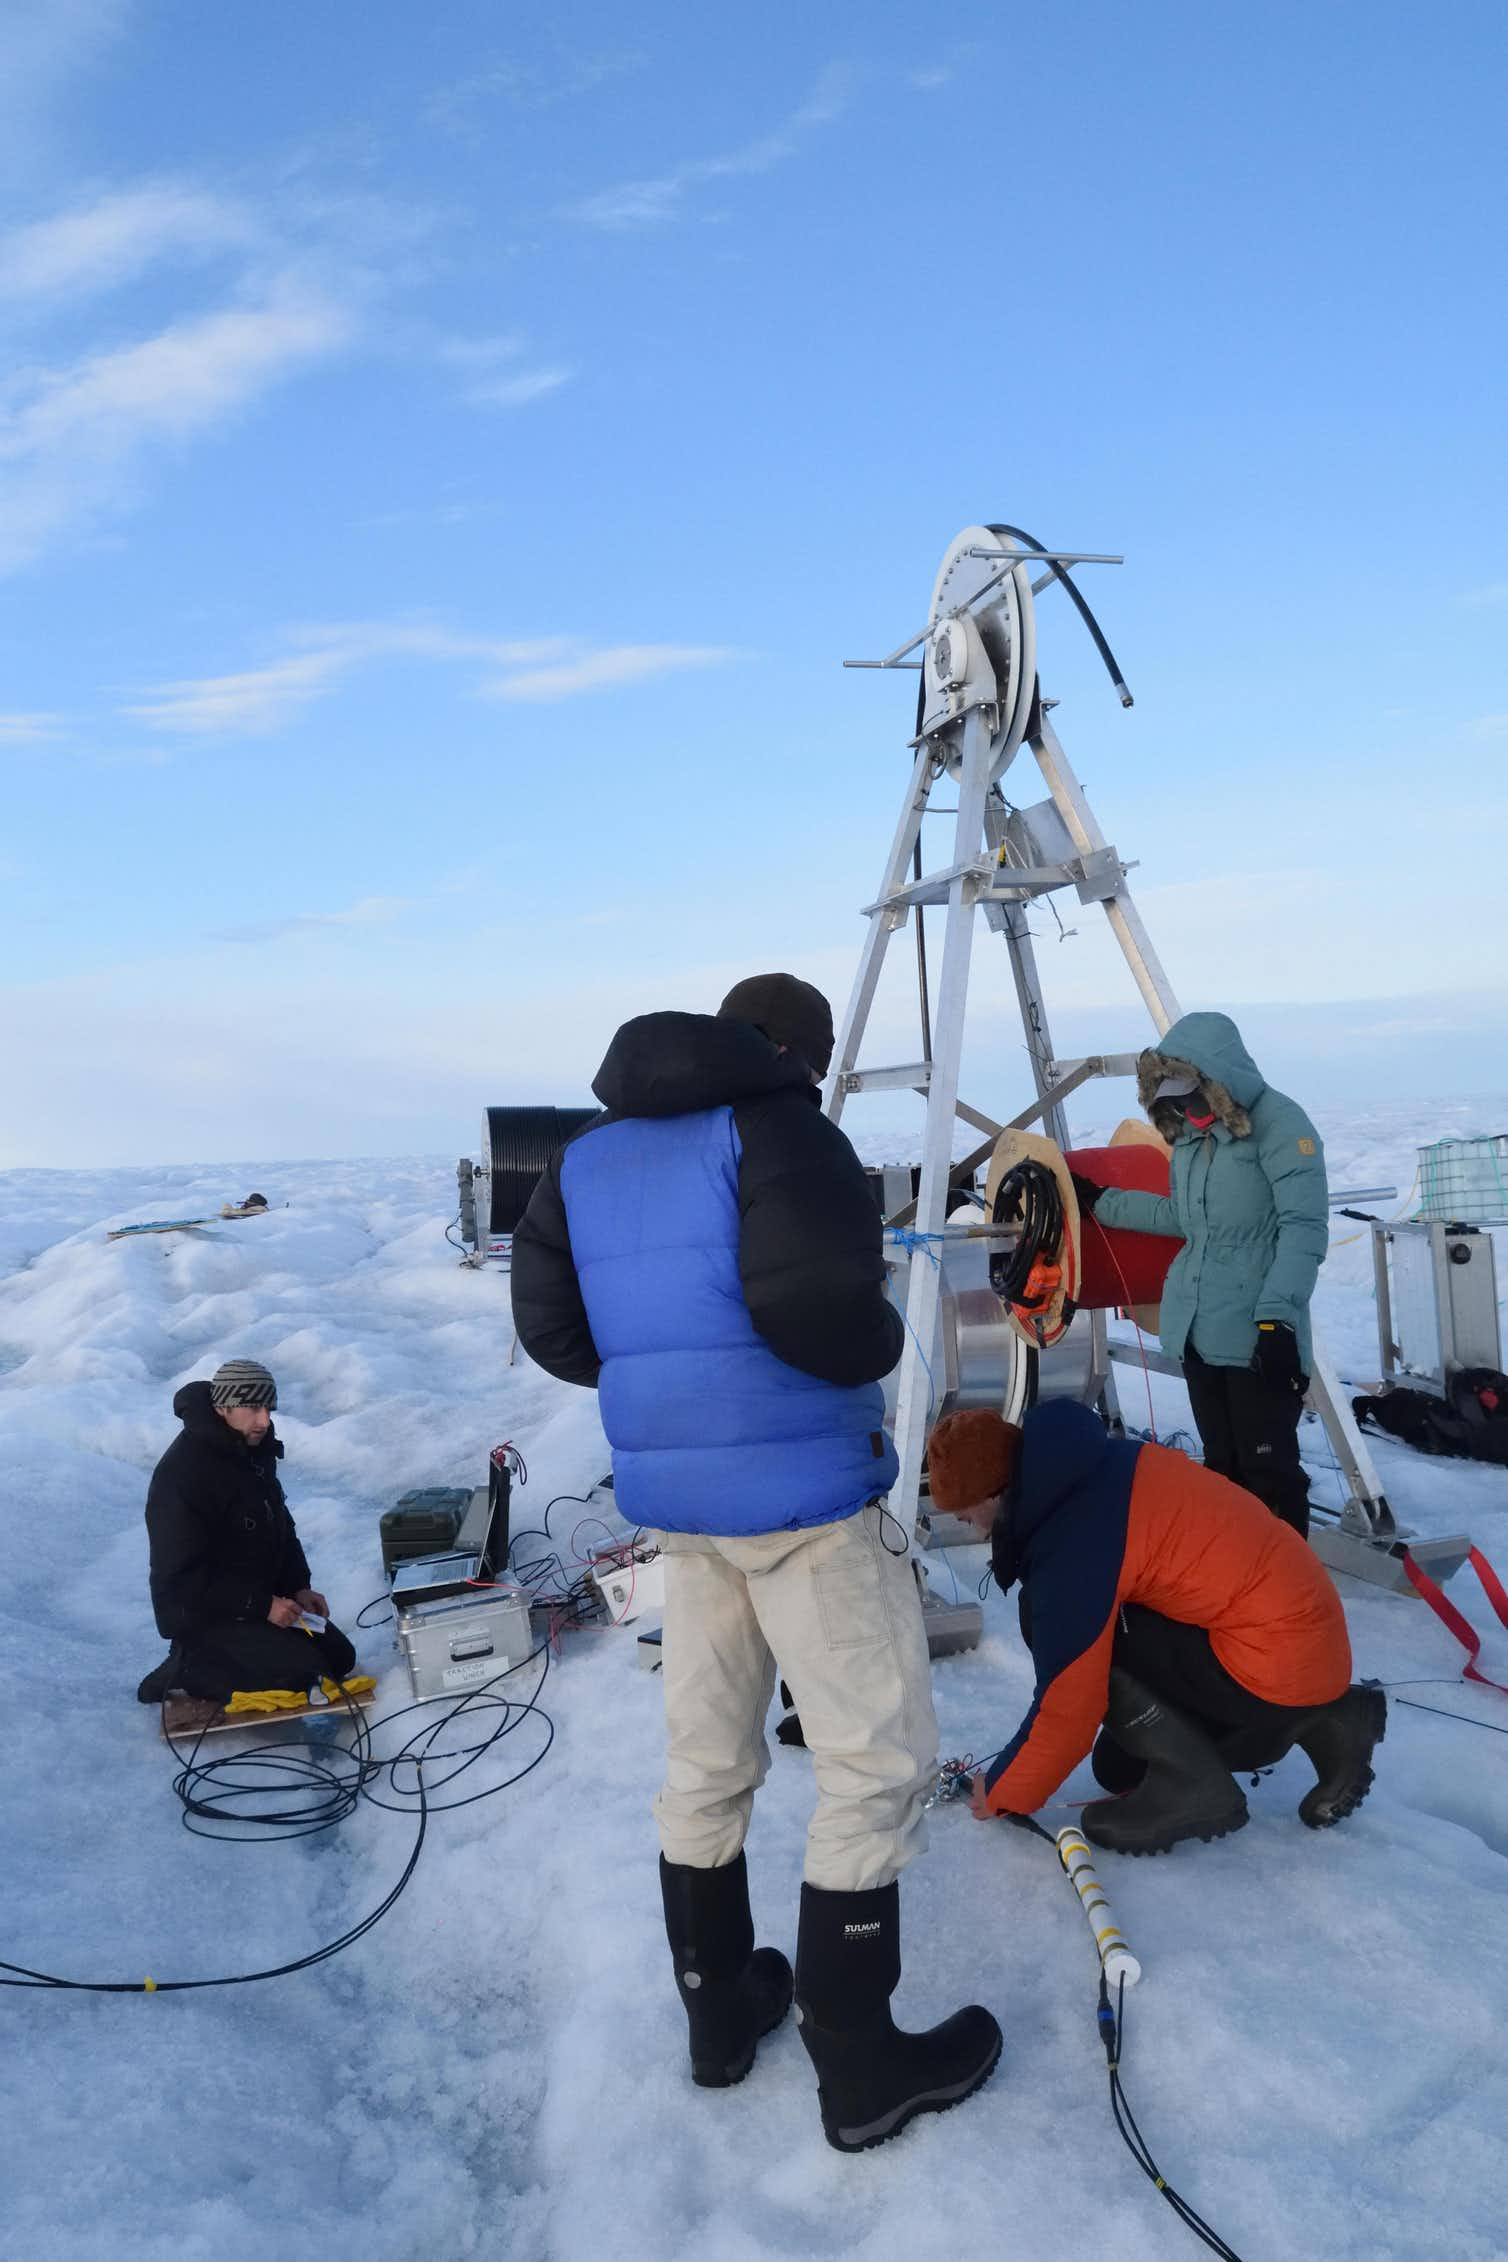
As part of the EU-funded RESPONDER project based at the Scott Polar Research Institute, University of Cambridge, we installed a kilometer-long stretch of fiber-optic cable to explore the properties of Sermeq Kujalleq, also known as Store Glacier, in West Greenland. Situated 28 kilometers from the front of the glacier, our study site creeps west at a rate of around 500 meters per year.
To get the cable in place, colleagues from Aberystwyth University used a hot-water drill to bore a 1,040-meter hole downwards through the ice before we threaded the cable in. The cable connects at the surface to a computer, called an interrogator, which fires and records the laser pulses.
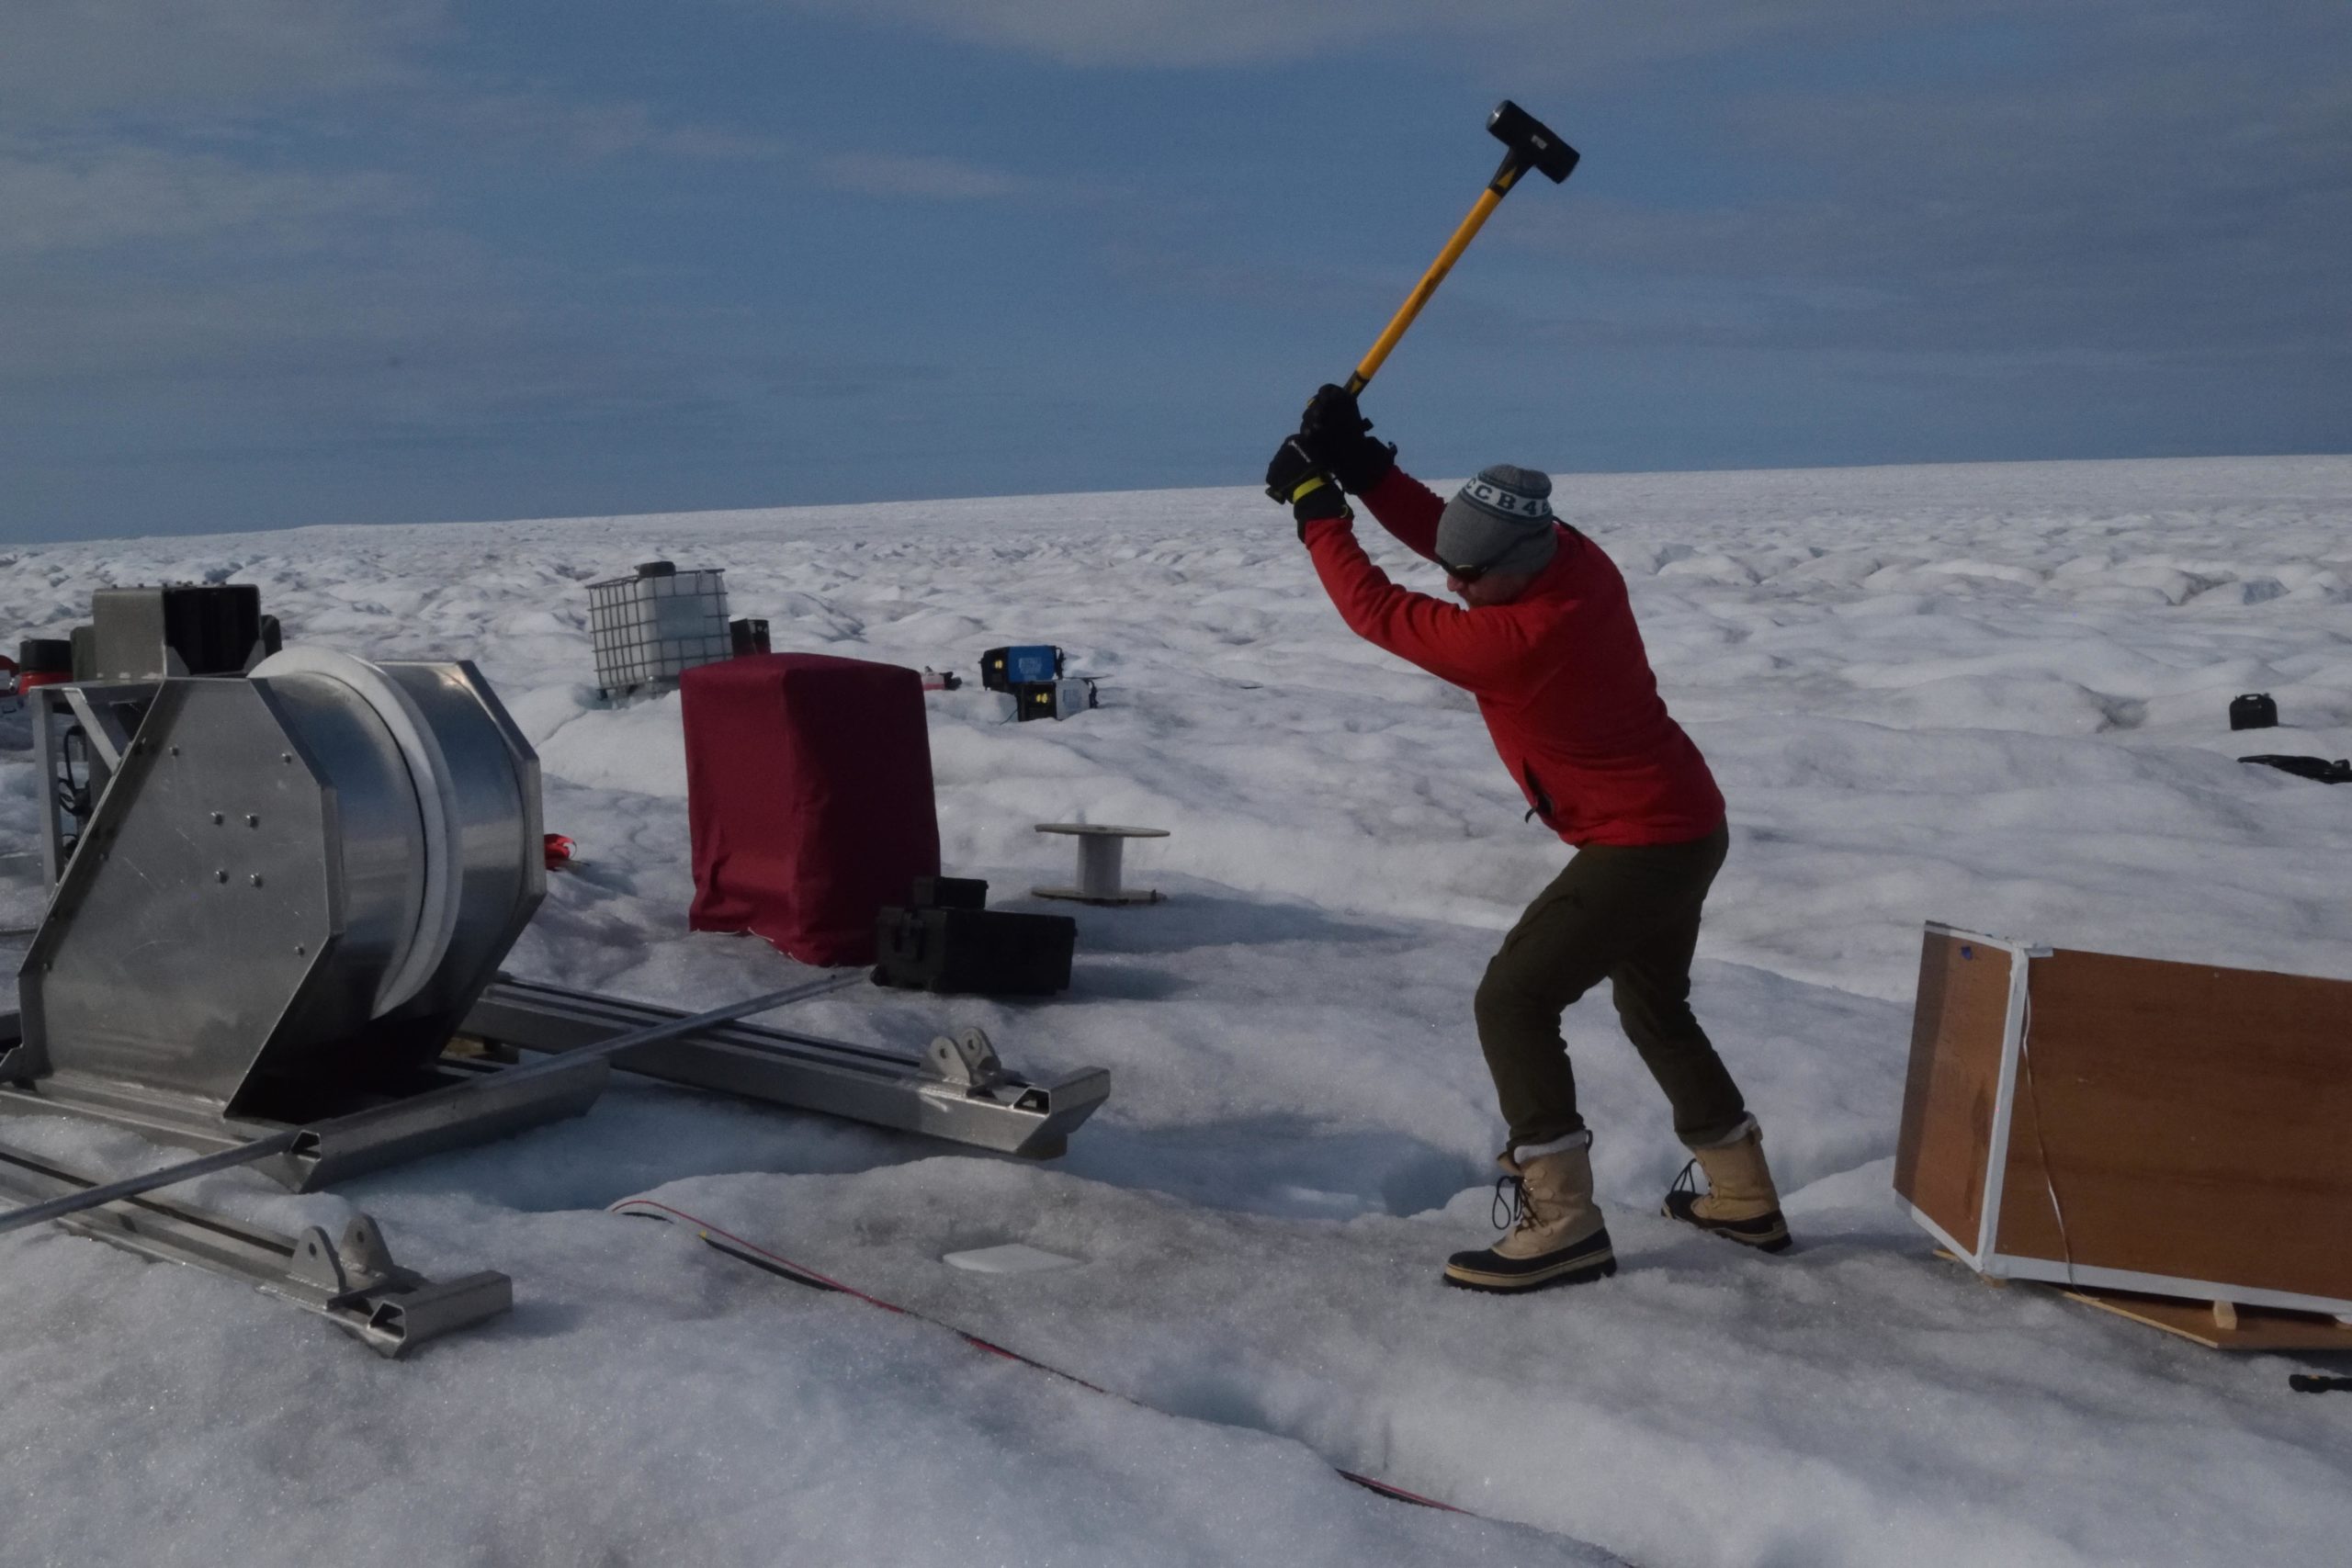
Over six weeks, we monitored the cable to determine the temperature differences throughout the glacier’s layers. We also investigated ice stiffness, an indicator of how easily ice flows, by measuring variations in how quickly seismic vibrations travel through the ice along the cable length: faster vibrations can indicate stiffer ice. For this, we made our own DIY shockwaves by hitting the surface of the glacier with a sledgehammer.
The anatomy of a glacier
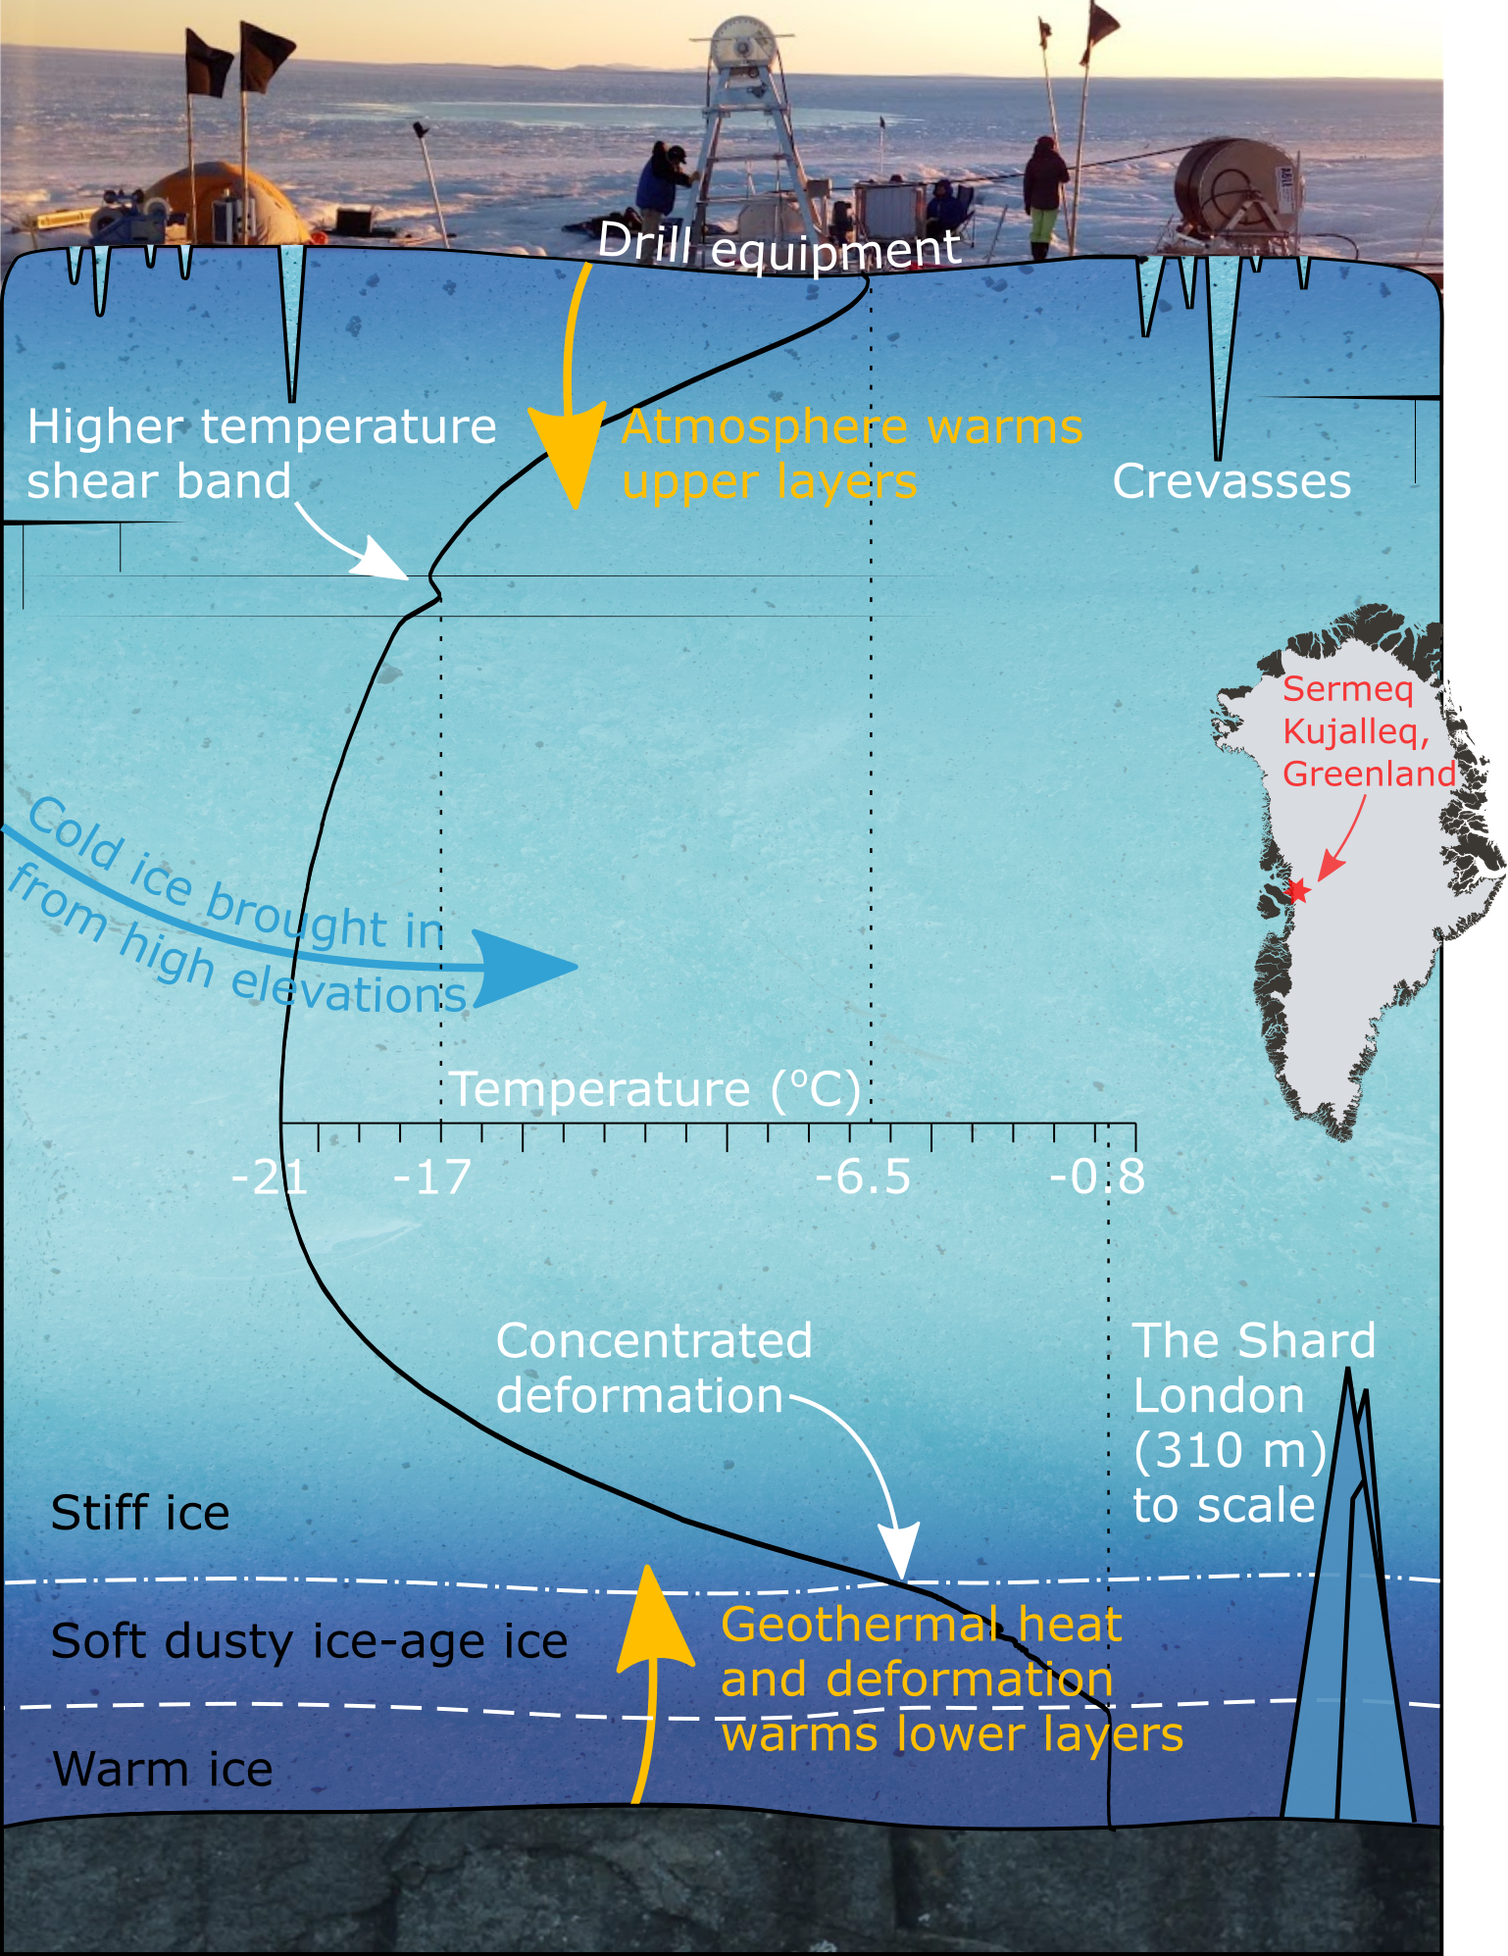
The result is the most detailed description to date of the thermal and mechanical structure of the glacier. The internal temperature of glaciers is controlled by a few key processes. At their center lies a core of extremely cold, stiff ice. As it continues its journey coastwards, the glacier surface is heated to minus 6.5 degrees Celsius — tropical in comparison — by sunlight and warmer air.
But nearest to the ground, the glacier is warmer still, as the constant churning of internal ice crystals generates heat. Add the heat naturally radiating from within the earth, and ice temperature approaches 0 degrees C.
At these depths, ice coexists with small pockets of liquid water, similar to how snow becomes slush. We call such ice “temperate” and, in terms of glacier flow and eventual ice loss, it’s where the action is. That means it’s vital to understand how much temperate ice we’ve got.
(Robert Law)
So what did we find?
First, the heat map of our glacier showed far more variability than we’d expected. We found concentrated patches of heat in areas where the ice was particularly deformed, even at relatively shallow depths — something never previously observed in glacier ice.
Second, we observed three distinct ice layers within the glacier. Two of these were predictable. The upper 890 meters of the glacier was made of cold and stiff ice. Beneath that was older, weaker ice dating back to the last ice age. This ice is weaker because it contains particles of ice age dust, which disrupts the bonds between individual ice crystals.
(Adam Booth / Author provided)
But the biggest surprise of all was hiding in the lowermost 70 meters of the glacier, where we found a large quantity of temperate ice. This might be expected in warm Alpine environments, but at such depths in Sermeq Kujalleq, the heat required to produce liquid water can only be produced by significant ice deformation: evidence of just how dynamic the base of the ice sheet is.
These observations not only help explain why the Greenland ice sheet is losing so much mass, they also help us predict future patterns of ice loss and sea level rise.![]()
Robert Law is a PhD candidate at University of Cambridge and Adam Booth is associate professor in applied geophysics at the School of Earth and Environment at the University of Leeds.
This article is republished from The Conversation under a Creative Commons license. Read the original article.