How Arctic ice cores helped track the ups and downs of the Roman Empire
Scientists have tracked lead emissions in the ice core record, a proxy for coin production and economic prosperity.
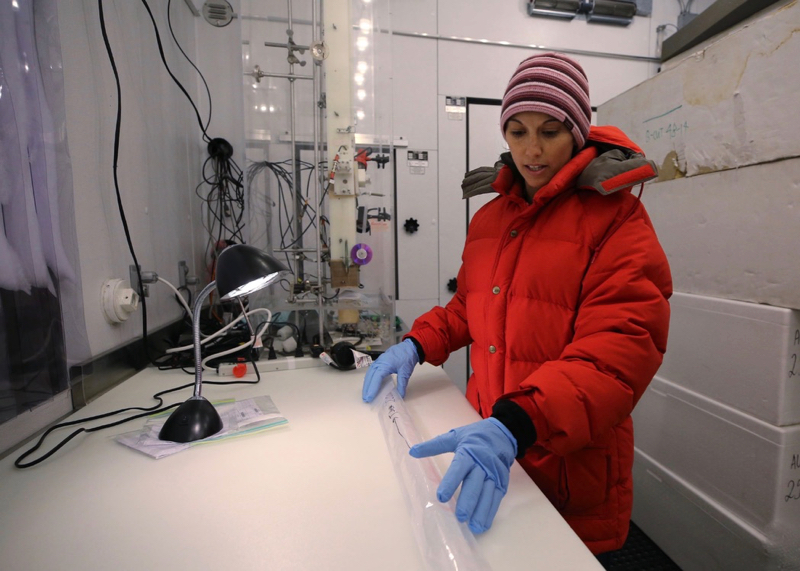
Hundreds of miles away, thousands of years in the future, an ice core has helped chart the peaks and lows of the Roman Empire.
In a new study released in the journal Proceedings of the National Academy of Sciences, researchers from universities in the U.S., England, Norway and Denmark detail how they used an ice core from a central Greenland glacier to track lead emissions dating from 1,100 BC to 800 AD.
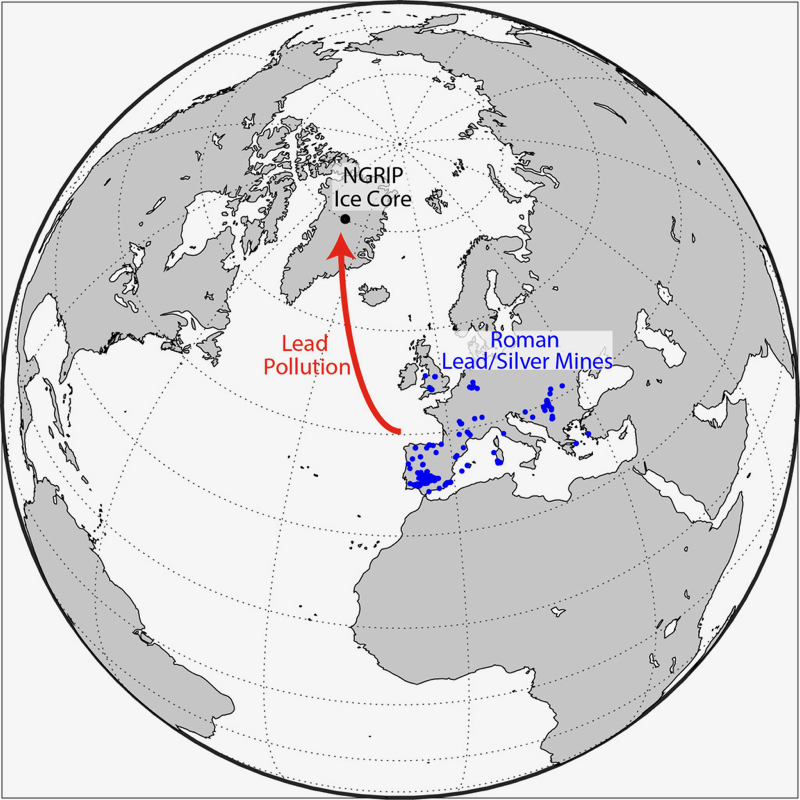
These emissions are a proxy for coin production, as the mining and smelting of silver for coins lead to an increase of lead pollution in the past, which then floated over to Greenland and settled down, forming a layer of lead-laced ice.
An increase production of lead closely tracked with successes of the Roman Empire. The highest sustained levels of lead pollution coincide with the time known as Pax Romana, a long period of peace and economic prosperity spanning roughly two hundred years. Lows of lead production detailed the opposite.
“We found that lead pollution in Greenland very closely tracked known plagues, wars, social unrest and imperial expansions during European antiquity,” Joe McConnell, research professor of hydrology at the Desert Research Institute, said in a statement.
For example, lead emissions took a tumble during two major plagues in the second and third centuries, and they were very low during the last 80 years of the Roman Republic, a time of extended political instability and social unrest.
While this study isn’t the first time scientists have tried to use ice cores to reconstruct past historical events pertaining to the Roman Empire, it’s the most detailed. In the mid-1990s, another study used a similar technique to analyze lead emissions in Greenland ice, although it only used 18 data points compared to the 25,000 measurements used in this study.
“We believe this is the first time such detailed modeling has been used to interpret an ice-core record of human-made pollution and identify the most likely source region of the pollution,” co-author Andreas Stohl, a senior scientist at the Norwegian Institute for Air Research, said in a statement.