A Danish satellite effort is poised to make vast improvements to Greenland maps

Getting hold of a map of Greenland is easy enough. But if you want one that is precise enough to use for infrastructure planning, navigation, mining or the like, you have, until now, either searched in vain or had to make one yourself.
Most maps of Greenland today are made using data collected during flyovers in the 1930s and the 1980s. This is a good part of the reason why zooming in on a computerised map leaves you with little more than a place name and perhaps a few contour lines.
Satellite images exist, but even though they show details such as homes, roads and even football goals (see the same area as a Google map), a lack of uniformity and the sort of detail cartographers need, means they are of little use in mapmaking.
Until now, collecting the data needed to make precise maps has required taking pictures from airplanes, but the cost and time required for this has resulted in an incomplete hotchpotch of data.
This has several consequences. Rescue services, for example, cannot combine GPS with existing maps, making it more difficult to find people who are lost or stranded somewhere away from a populated place.
Local and national authorities planning infrastructure, or mining firms looking to begin operations, can have their own detailed maps produced. But this is costly, and, in the case of private investors, the unwanted expense could be a deal-breaker.
This now appears set to change. Danish officials today announced promising initial results of a project using satellites to collect cartographic data faster and more efficiently than has been possible using planes.
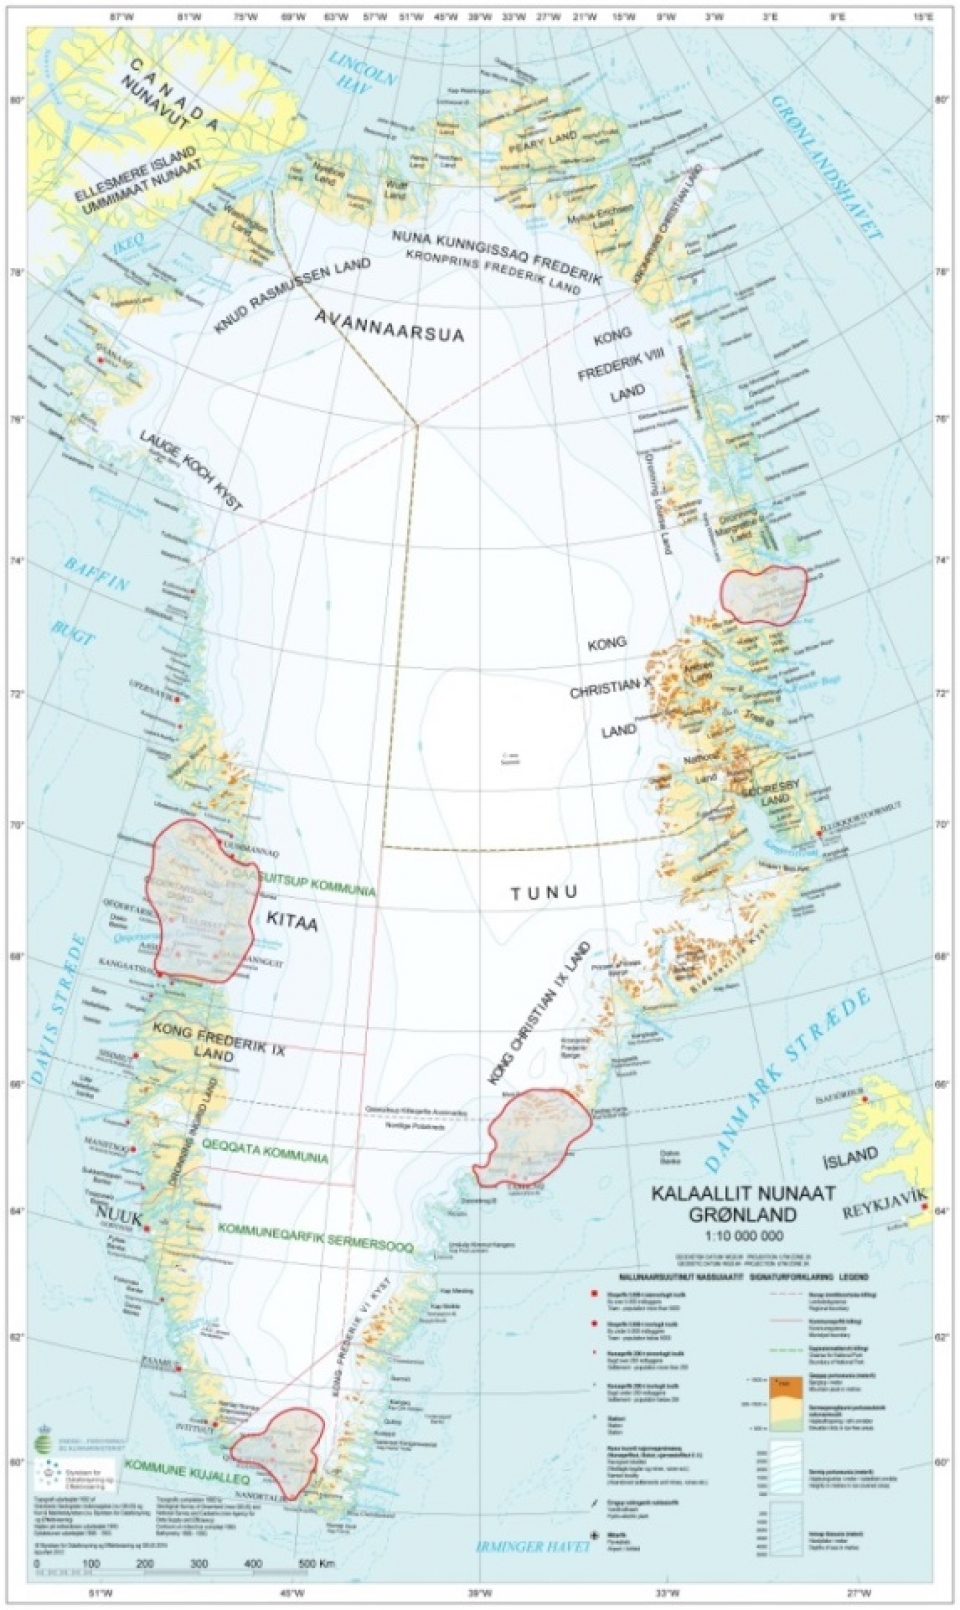
The project involved using SPOT 6 and 7, two commercially operated European satellites, flying at an altitude of 700 kilometers to collect images of four specific areas (see map below). The pictures they returned over a two-year period beginning in 2015 each measure 360 square kilometers. Objects as small as 1.5 meters can be discerned in the pictures, making them detailed enough to be used to make precise, high-resolution maps.
Cartographers are now in the process of turning the data into finished, online maps. The maps themselves are expected to publicly available by autumn. But, even before that, the data gathered by the satellites will be placed online.
Europeans will have free access to use the data. Other nationalities will be able access the data, but not manipulate them for their own purposes.
Should the maps produced using the data prove useful to those on the ground, the prospects for better Greenland mapping will be looking up, thanks to satellites looking down.